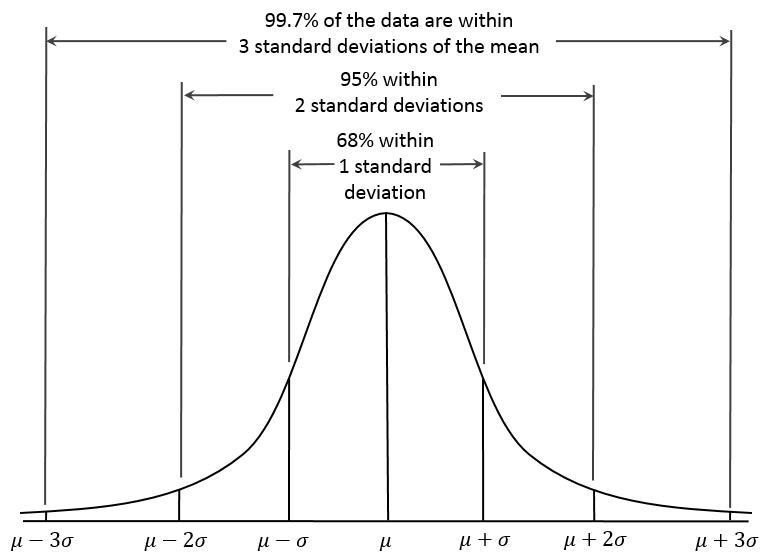
Standard deviation graph and what does it mean to educationist?
The representation of ‘μ’ refers to the mean or average in statistical terms. Standard deviation shows the distribution of values around the mean. The above bell curve shows the distribution within 1 standard deviation(σ), 2σ and 3σ. The distribution shows that 68% of any given data lies within + 1σ, while 95% of the data lies within + 2σ and 99.7 % of data lies within + 3σ. The same applies for analysis data of performance from the education scenario. The standard deviation within a dataset can help us understand how students perform and what modification to be done to achieve a better outcome.
Image source: http://blog.shakehandwithlife.in/2014/06/normal-curve-area-under-normal-curve.html
The data distribution around the mean value signifies the overall performance of the given group. Small standard deviation shows the less differences(variance) among scores of individuals within a group which result in the increase in sharpness of the peak. Such group-learning is more organised and needs to be promoted on the same lines. As the group flattens, it means that variance among performance in the given group is large. This shows that either adopted methodology is not working out within the groups. Instructional design or methods adopted for the concept delivery or assessment needs immediate change.
Note: Sometimes a sharp peak may indicate the leniency or the easiness in the set exam. Above said condition is considered only for level appropriate examinations conducted by on a large scale without interference or influences of any sort. Thus, the curve can also be used to determine the standard of the examination under consideration when verified among different groups of the same class.
Image source: https://www.quora.com/What-does-SKEWED-DISTRIBUTION-mean
The increased sloping of the curve towards the right or left is referred to as skewness. When a normal distribution is skewed it means that the position of the mean shifts from the centre to the right or left. When the skewness is towards the right, it means a positive skew and when it is towards the left, it is negative. The skewness when related to education show the class performance. Skewness in educational data represents the variation in the learning differences that has creeped into the classroom. Normal condition where all three mean, median and mode coincide is an ideal case, however, with the slope we can understand whether most of learning has happened or not. A positive skew is what we generally hope for, which indicate most learning has happened while a negative skew indicate that general learning has not happened for the concept under considered.
Skewness also predicts the learning achievement among the learners. Negatively skewed data must be analysed with more care to understand the variation in the learning process. The variance among the data from the mean shows that most learner achievement is far below average. This can indicate many aspects in the classroom learning starting from
- Change in instructional design
- Learner types correlating the concept delivery
- Period of delivery
- Change in teacher during the delivery
- Complexity in curriculum
- Standard of question paper etc.,
Skewness of the data, thus requires further analysis for better understanding of various pitfalls discussed. Further categorisation on learning performances can also be done using statistical distribution. This can also be done on individual performance for various subjects concerned to understand the details of the complex issue of learning.
The above information is more generalized and is not considering any particular data, individual data shows more information regarding the performance and its scope for improvement. The need for data analysis in education has increased further with the involvement of technology in the field of learning. When performance, properly supported through data analysis, provides the right path for the learning journey of an individual.
